See exactly where your building loses heat
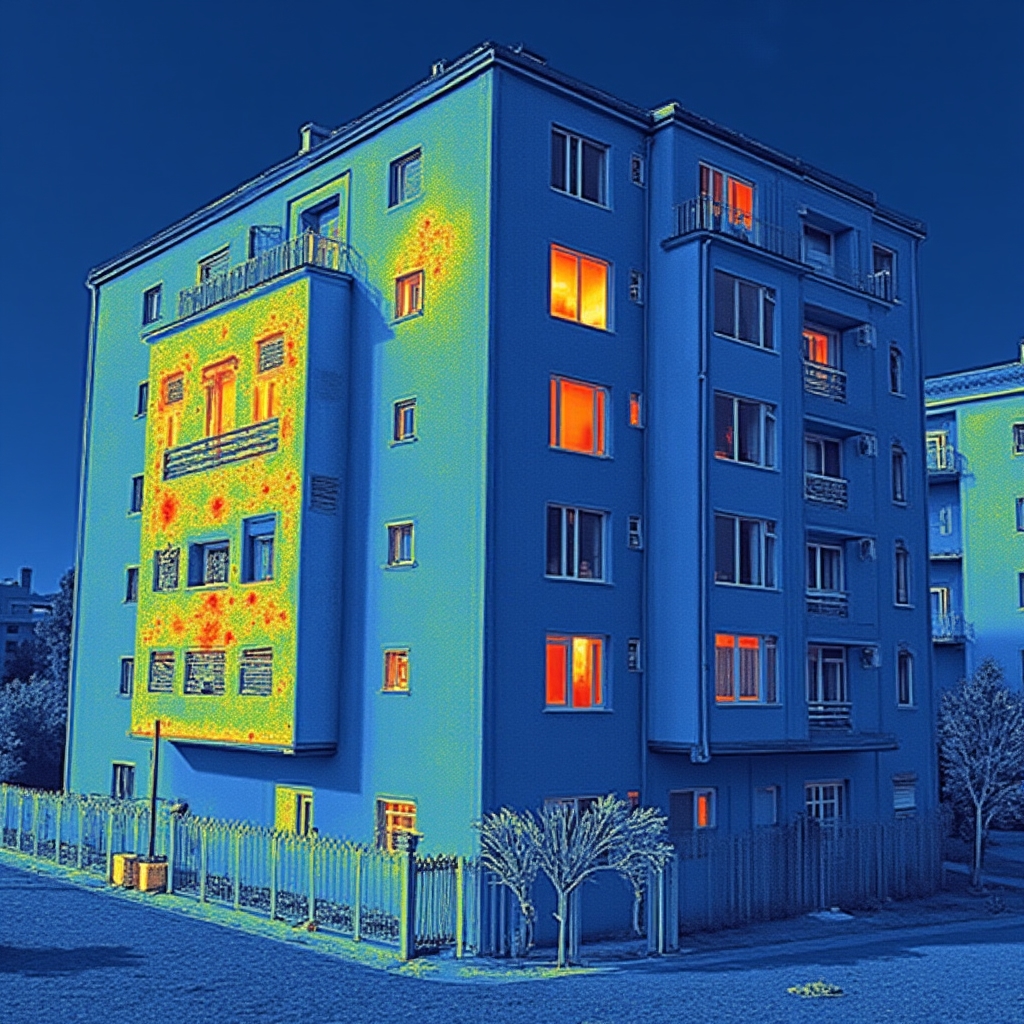
We map residential building facades using drone-mounted infrared cameras. Every heat bridge, deteriorated window seal, and insulation gap appears in your report — painted in red directly over the building photograph.
Request a Thermal Survey
Tell us about your building and we will provide information about the process and scope.
The hidden problems costing you heat
Infrared thermography reveals anomalies invisible to the naked eye. These are the most common findings in Chilean residential buildings.
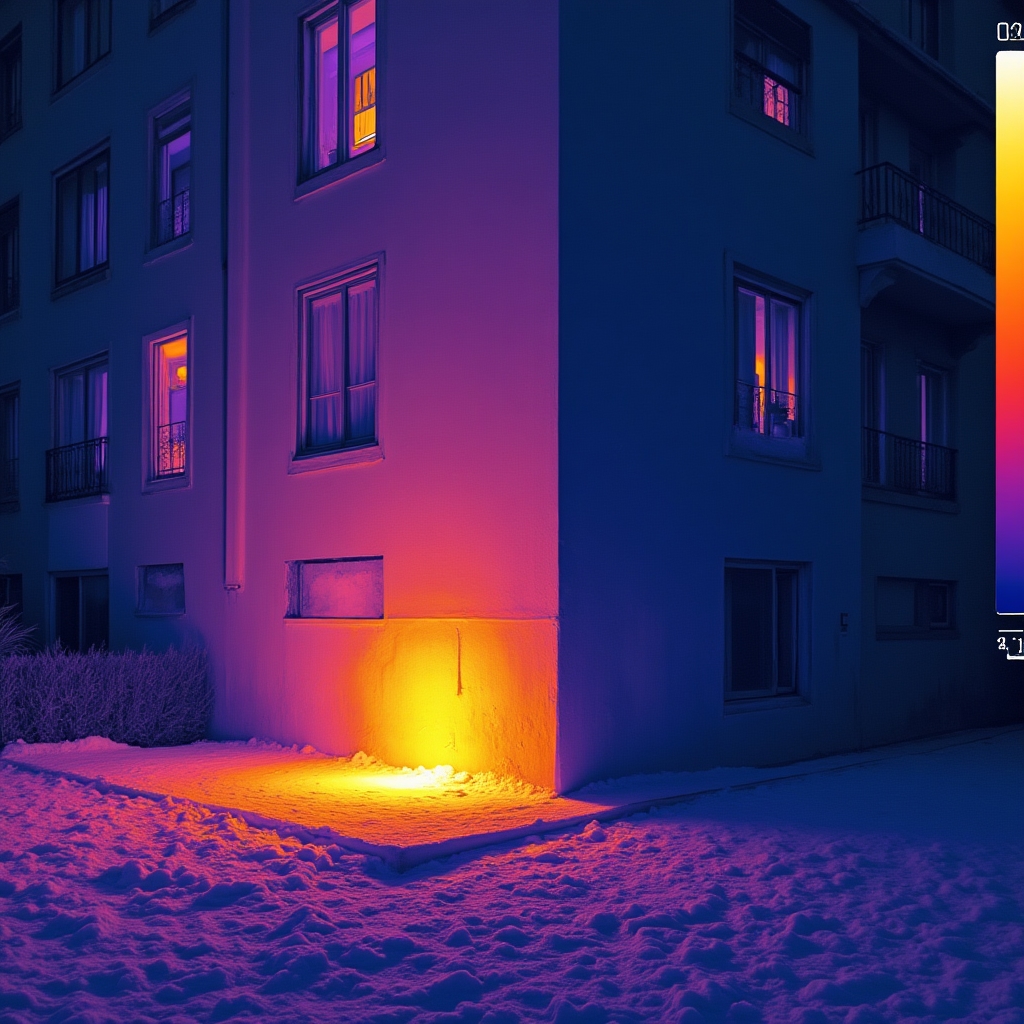
Thermal Bridges in Slabs
Concrete slabs conduct heat efficiently between floors and to the exterior. Infrared imaging shows these pathways as bright warm zones in winter scans.
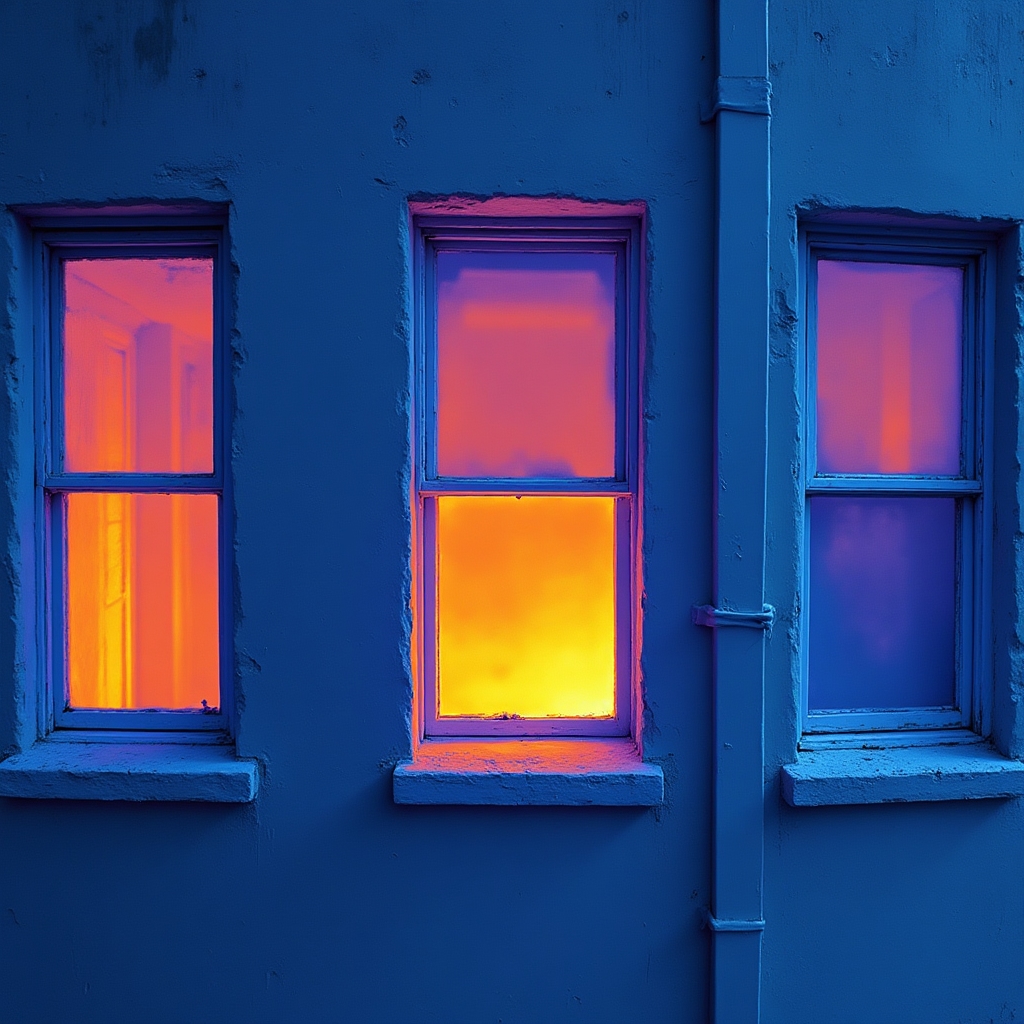
Deteriorated Window Seals
Aged or poorly installed window perimeter seals create continuous air infiltration paths. The thermal camera shows these as cold-edged frames in winter.
Insulation Deficiencies
Missing, compressed, or incorrectly installed insulation leaves zones of high thermal conductance visible as irregular temperature patterns across the facade.
From survey request to actionable report
A structured four-step process designed to deliver clear, useful information about your building's thermal performance.
Initial Consultation
We review the building's characteristics, location, and the specific concerns of the community or property manager to define the scope of the thermal survey.
Drone Thermal Flight
Our drone equipped with a calibrated infrared camera performs a systematic flight around the building, capturing thermal images of every facade section under optimal temperature conditions.
Thermal Analysis
Infrared images are analyzed to identify and classify thermal anomalies — heat bridges, air infiltration zones, moisture indicators, and insulation gaps — with temperature differentials documented.
Visual Report Delivery
A comprehensive PDF report is delivered with problems highlighted in red directly on the building photographs, accompanied by infrared overlays, location descriptions, and technical context for each finding.

A report that speaks for itself
Every finding in the thermal survey is translated into a visual document that building administrators, committee members, and skeptical co-owners can interpret without any technical background.
Thermal survey packages
We offer different service scopes depending on the building size, the level of detail required, and the intended use of the findings.
Facade Screening
A complete thermal scan of all exterior facades, identifying the main categories of anomaly present in the building envelope.
- Full exterior facade coverage
- Thermal anomaly classification
- Visual PDF report with red markers
- Infrared image archive
Detailed Diagnostic
In-depth analysis combining facade screening with floor-by-floor thermal mapping and individual anomaly documentation with location coordinates.
- Everything in Facade Screening
- Floor-by-floor thermal map
- Individual anomaly geo-location
- Temperature differential table
- Technical summary for administrators
Seasonal Monitoring
Two thermal surveys — one in winter and one in summer — to document both heat loss and heat ingress patterns throughout the year.
- Winter heat loss scan
- Summer heat ingress scan
- Comparative seasonal report
- Year-round thermal profile
- Priority intervention list
Ready to understand your building's thermal performance?
Contact us to discuss your building's characteristics and receive information about the thermal survey process and what the report includes.